Fourier Transform Infrared (FTIR) Spectroscopy for Glycan Analysis
Fourier-transform infrared (FTIR) spectroscopy is a phenotypic method, which quantifies the absorption of infrared light by molecules, including lipopolysaccharides, lipids, carbohydrates, nucleic acids, and proteins, resulting in a specific FTIR spectrum that reflects the overall composition of the sample. In the scenario of high-throughput production of recombinant glycoproteins from both prokaryotic and eukaryotic organisms, the availability of this simple technique providing insight into the structural, conformational and functional properties would be of great help. Powered by top-class scientific experts and expertise in glycan analysis, Creative Biolabs is fully competent and dedicated to serving as your one-stop-shop for glycan analysis using FTIR spectroscopy.
Introduction of FTIR Spectroscopy
FTIR spectroscopy is a non-invasive and label-free spectroscopic technique, which can be widely used for the study of molecular structure with no restriction on their molecular mass. The energy of infrared light facilitates transitions between vibrational energy states of chemical compounds. Since the energies of these vibrational transitions are characteristic of particular chemical bonds, FTIR spectroscopy can be applied to obtain information about the functional groups and chemical structure of a compound, or the composition of a mixture of compounds. FTIR spectroscopy requires a very limited amount of material and allows obtaining a biochemical fingerprint of the sample under investigation, providing information on the content and structure of its main biomolecules, as well as on their chemical modifications. In the case of complex biological systems, within a single measurement, this spectroscopic approach provides information on the main biomolecules found in the sample, including lipids, proteins, nucleic acids, and carbohydrates.
As FTIR spectrometer can simultaneously collect high-resolution data over a wide spectral range in a short time, it has been widely used for carbohydrate analysis. The wavenumber between 950 and 1200 cm−1 in FTIR spectrometer is considered as the ‘fingerprint’ region for carbohydrates, allowing the identification of major chemical groups in polysaccharides because the position and intensity of the bands are specific for every polysaccharide.
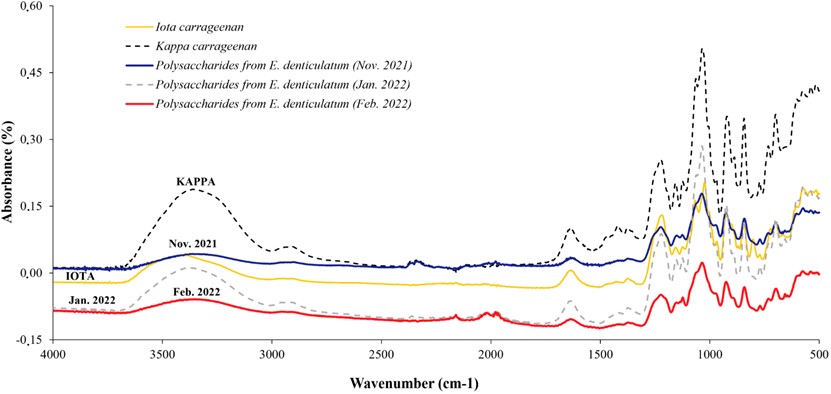 Fig.1 FTIR spectra of carrageenan and polysaccharide extracts.1
FTIR Spectroscopy for Glycan Analysis at Creative Biolabs
Since FTIR spectroscopy analysis does not involve extensive sample preparation, it allows for a high-throughput nondestructive and low-cost analysis of complex carbohydrate constituents in samples. The spectral information generated from FTIR spectroscopy is generally complex and extensive, requiring sophisticated data reduction techniques such as principal component analysis. Principal component analysis can identify the most distinctive features of the collected spectra and reduce the dimensionality of the data from several hundred data points to a fewer number of dimensions.
Studies have indicated that FTIR spectroscopy can offer a reliable tool for the characterization of this post-translational modification, which is a major issue in recombinant protein production. With Ph.D. level scientists and substantial experience in glycan analysis, we apply FTIR spectroscopy for the study of the recombinant protein glycosylation through the analysis of the glycan band in the region 900-1200 cm−1.
For carbohydrate analysis using FTIR spectroscopy, glycans result in bands in the regions 1020-1130 cm−1 resulting from absorption by an individual sugar ring, and 1140-1180 cm−1 resulting from absorption by the C-O-C bonds in polysaccharides. Thus, the band between 1140-1180 cm−1 can be correlated to the polysaccharide content while the 1020-1130 cm−1 band gives a measure of the total carbohydrate content. Thus, by measuring the absorption across the relevant part of the infrared spectrum, it is possible to assess the relative proportions of carbohydrates in a mixture.
Highlights
-
High-resolution data over a wide spectral range in a short time
-
Non-invasive and label-free
-
Low amount of sample
-
Highly sensitive
-
In a low cost and nondestructive manner
FTIR spectroscopy enables high-throughput identification of the major compositional differences across a large set of samples in a low cost and nondestructive manner. Creative Biolabs is pleased to share our cutting-edge technology and extensive expertise in applying FTIR spectroscopy for glycan analysis to facilitate our clients’ research and project development. For more detailed information, please feel free to contact us or directly send us an inquiry.
Reference
-
Vandanjon, Laurent, et al. "The use of FTIR spectroscopy as a tool for the seasonal variation analysis and for the quality control of polysaccharides from seaweeds." Marine drugs 21.9 (2023): 482. Distributed under Open Access license CC BY 4.0, without modification.
For Research Use Only.
Related Services
