Optimizing LNP Molar Ratios
for Transfection Efficiency
A comprehensive guide for Vaccine R&D scientists struggling to crack the "black box" of lipid ratios. Discover how optimizing the N/P ratio drives endosomal escape, stability, and delivery performance.
The "Black Box" of Vaccine Formulation
In the rapidly evolving landscape of vaccine R&D, Lipid Nanoparticles (LNPs) have emerged as the premier delivery vehicle for mRNA. However, for many researchers, formulation remains a "black box." You may have the perfect mRNA sequence, but if the Lipid-to-Nucleic Acid ratio is off, your transfection efficiency can plummet, or worse, your formulation becomes toxic.
The struggle is real: Balancing the N/P ratio (Nitrogen-to-Phosphate ratio) is not just about neutralizing charge; it is about engineering the particle's internal architecture to facilitate endosomal escape. A slight deviation in molar ratios can shift the ionization profile (pKa) of your nanoparticle, rendering it ineffective in the acidic endosomal environment.
Common Challenges in R&D:
- Inconsistent particle size distributions (high PDI).
- Low encapsulation efficiency (< 80%).
- Poor endosomal escape leading to low protein expression.
- Instability during storage (aggregation).
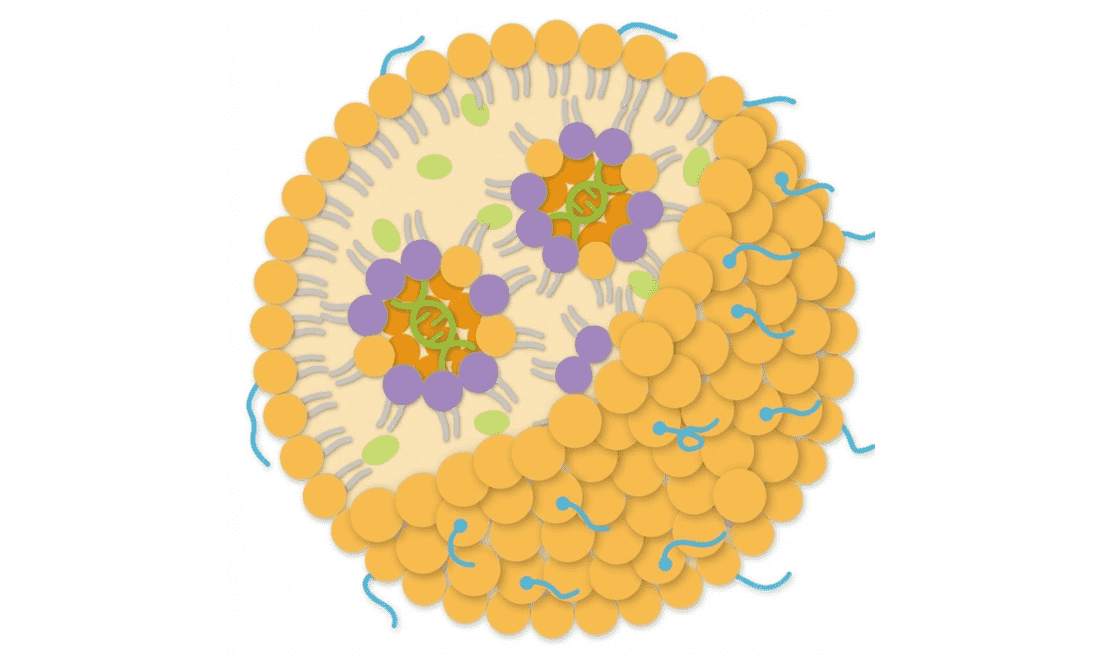
Anatomy of an LNP: The Molar Ratio Matrix
A typical LNP is composed of four distinct lipid components. The molar ratio of these components is the "recipe" that determines the particle's physical stability and biological potency. The industry "gold standard" typically follows a 50:10:38.5:1.5 ratio, but optimization is key for novel payloads.
1. Ionizable Lipid
~35–50 mol%
The primary driver of encapsulation and endosomal escape. It is positively charged at low pH (to bind RNA) and neutral at physiological pH.
2. Helper Lipid (PC/DOPE)
~10–15 mol%
Structural lipids like DSPC or DOPE that stabilize the bilayer. Phosphatidylcholine (PC) lipids are critical for maintaining morphology and preventing premature leakage.
3. Cholesterol
~35–45 mol%
Fills gaps between lipids, modulating membrane fluidity. It plays a crucial role in preventing serum protein adsorption and enhancing stability in circulation.
4. PEG-Lipid
~1.5–3.0 mol%
Controls particle size and prevents aggregation (steric stabilization). Also dictates circulation half-life by reducing clearance by the RES system.
Decoding the N/P Ratio
The N/P ratio represents the molar ratio of the positively charged nitrogen atoms (N) in the ionizable lipid to the negatively charged phosphate groups (P) in the nucleic acid backbone.
// Calculation Formula
N/P Ratio = (Moles of Ionizable Lipid × N per lipid) / (Moles of RNA × P per base)
* Note: P per base is roughly 3 for mRNA (avg MW ~320-340 Da per nucleotide).
Why is it critical?
An N/P ratio of 1:1 theoretically neutralizes the charge. However, in practice, LNP formulations require an excess of cationic lipid (typically N/P > 3) to:
- Ensure complete encapsulation (>90%) of the mRNA.
- Condense the mRNA into a compact core.
- Provide sufficient positive charge during endosomal acidification to disrupt the endosomal membrane and release the cargo ("Endosomal Escape").
The "Goldilocks" Zone
Low N/P Ratio (< 3)
Poor encapsulation efficiency; unstable particles prone to aggregation; incomplete charge neutralization leading to low cellular uptake and rapid degradation of exposed RNA.
Optimal N/P Ratio (6 – 10)
High encapsulation (>95%); typically sizes 60-100 nm; optimal balance of safety and potency. Note: Pfizer/BioNTech and Moderna COVID-19 vaccines utilize an N/P ratio of approximately 6.
High N/P Ratio (> 20)
High cytotoxicity; potential for immune stimulation independent of the cargo; may result in overly rigid particles that fail to release cargo inside the cell.
Impact on Critical Quality Attributes (CQAs)
Adjusting the N/P ratio shifts the physicochemical landscape of your LNP.
Transfection Efficiency
Efficiency generally increases with N/P ratio up to a plateau. However, excess cationic lipid can be cytotoxic. The goal is to find the minimum N/P ratio that yields maximum expression.
Zeta Potential
As N/P increases, the surface charge (Zeta potential) becomes more positive. While this aids in cell membrane interaction, highly positive particles are rapidly cleared by the RES system in vivo.
Encapsulation Efficiency
Encapsulation usually saturates (near 100%) at N/P > 3. Below this threshold, valuable mRNA remains free in solution, vulnerable to degradation by RNases.
The Golden Rules of Formulation
Best practices derived from successful clinical translations and our extensive internal R&D.
Start with an N/P Ratio of 6:1
This is the industry benchmark used in FDA-approved mRNA vaccines. It provides a robust balance between encapsulation (>95%), particle size (<100 nm), and tolerability. Use this as your control arm in any optimization study. Deviating significantly without data justification is a common pitfall.
The 3-to-1 PEG Rule
PEG-lipids are double-edged swords. While they prevent aggregation, "shedding" of the PEG layer is required for cellular uptake. For systemic delivery, a PEG molar ratio of 1.5% is standard. Increasing PEG to >3% produces smaller particles but significantly extends circulation time, often reducing cellular uptake in the liver due to the "PEG dilemma."
Screening is Non-Negotiable
No two ionizable lipids behave exactly the same. An N/P of 6 might work for Lipid A, but Lipid B might require N/P 10 for the same transfection efficiency. We recommend a Design of Experiment (DoE) approach screening N/P ratios of 3, 6, 9, and 12 for every new lipid candidate.
Service Spotlight: Our LNP Development Service includes high-throughput microfluidic screening to identify the optimal ratio for your specific payload (mRNA, siRNA, or CRISPR RNP).
Watch the pH During Mixing
The N/P ratio calculation assumes the ionizable lipid is protonated. Formulation typically occurs in an acidic buffer (e.g., Sodium Acetate pH 4.0). Ensure your buffer exchange process (to neutral PBS) is efficient, as the pH shift triggers the structural reorganization of the LNP into its final, stable electron-dense core form.
Frequently Asked Questions
The N/P ratio is based on the molar ratio of positive charges (Nitrogen) to negative charges (Phosphate). The w/w ratio is simply the mass of lipids divided by the mass of RNA. While w/w is easier to measure during preparation, N/P is scientifically more accurate for understanding charge interactions. For many standard lipids, an N/P of 6 corresponds roughly to a w/w ratio of 10:1 to 20:1, depending on molecular weights.
If N/P is high (>6) but encapsulation is low (< 80%), the issue is likely not the ratio but the mixing process. Check your flow rate ratio (FRR) in the microfluidic device (usually 3:1 aqueous:organic) and ensure the pH of the aqueous buffer is sufficiently low (pH 4.0) to fully protonate the lipid. Also, verify the quality and purity of your RNA payload, as degraded RNA encapsulates poorly.
Generally, yes, the N/P ratio principles hold true. However, because siRNA is much smaller and rigid than mRNA, it may require slightly different ratios to achieve the same packaging density. It is highly recommended to screen a small range (e.g., N/P 4 to 10) when switching payloads from long mRNA chains to short oligonucleotides.
You need the molecular weight and the number of protonatable amines (usually tertiary amines) in the headgroup. If the lipid structure is proprietary, the manufacturer should provide a conversion factor. For standard lipids like DLin-MC3-DMA, there is one protonatable amine per molecule.
Still have questions about your specific formulation?
Online Inquiry
This site is protected by reCAPTCHA and the Google Privacy Policy and Terms of Service apply.
